More data is better in P2P debugging
By Slava Zuchenya – Mentor, A Siemens Business
P2P debugging taking too much time? Using Calibre RVE colormapping can help you quickly and accurately find and correct resistance and CD issues in your layout.
Reliability verification is a tough gig. You’re trying to find or anticipate problems in a layout that might affect the performance and/or product life of your product once it’s in use out in the real world. A few may be easy to spot, but most potential reliability issues are more subtle, and require careful and thorough verification to catch them. Point-to-point (P2P) resistance and current density (CD) simulations are a couple of critical processes used in the IC reliability verification process flow. They do a good job of helping the verification engineer ferret out parasitic effects that can wreak havoc on circuit performance. However, as every reliability verification engineer knows, debugging and correcting the errors you find can be time-consuming and resource-intensive.
How about a little help? What if you could get additional debugging data that could be used to help you quickly and accurately locate potential problem areas, and determine the appropriate fixes?
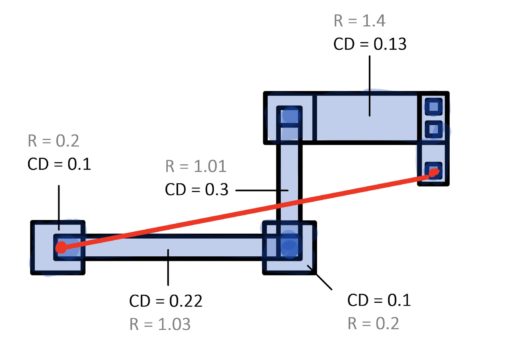
 For example, let’s say you know that you need to reduce the total resistance. While a P2P simulation result returns the total effective resistance value for an interconnect path, this one value doesn’t give you much of a clue as to which smaller segment of the whole path should be investigated first. But, breaking the path into smaller segments, and providing individual resistor body data (such as CD and resistance) for these smaller segments can help point you in the right direction for layout adjustments.
The Calibre™ PERC™ logic-driven-layout (LDL) P2P debug flow allows you to obtain more data about the smaller path segments for specific P2P results without the need to re-run a full Calibre PERC simulation on the entire design. Because the Calibre PERC tool can save voltage propagation and cross-reference metadata generated in the original full-chip P2P run, you can “restart” the P2P debug flow and save additional polygon data for specified P2P simulations in subsequent Calibre PERC runs. These subsequent P2P debug runs automatically produce an additional results database containing parameters such as CD, resistance, etc. for each individual resistor body (smaller path segments) in the path of the P2P results that were specified.
Using this additional data, you can quickly determine how the individual segments of the interconnect path behave in the context of the entire current path. And, by using the Calibre RVE™ colormap and net layer highlighting capabilities, you can also get a visual display of where the higher resistance and CD values are coming from in the P2P result path.
Want to get more details, and see an example of how it all works? Check out our white paper, Debug P2P results using resistance and current density data, to get on the fast path to reliable performance and consistent product lifetimes!


