Debugging with printf() or not …
My colleague Richard Vlamynck [who has been a guest blogger here] and I were discussing tracing and debugging. Like me, he has been doing software for a few years. Hence, when we considered tracing and instrumenting code, he commented “It used to be easy to see what effect trace statements had on your program because, as you put more or less trace cards in your Fortran deck, you could visually see it growing or shrinking.”
We have come a long way from the use of punched cards, but tracing and debugging are still very much a matter of concern …
The first real debugger for embedded software, which enabled developers to see what was happening in high level language terms, was XRAY Debugger, which was released by Microtec Research in late 1986. The timing of this release made sense, as it was just beginning to be feasible for each programmer to have their own computer. Before that, programming was largely done on paper in the first instance, and only entered on to a computer when access was available. This meant that programmers were quite careful and would “dry run” their code by hand before going anywhere near a computer. I have a sneaking suspicion that there were a few less bugs in those days, simply because time on a computer was precious and more thought was given to the code before it was entered. Nowadays, the approach of just throwing code at a debugger is all too common.
A common way to do debugging, before true debuggers were available, was to instrument the code – add strategically placed printf() calls [or the equivalent for the language in use]. Thus progress through the code could be observed. There might also be some kind of pause – a breakpoint really – where the code would be stopped, pending a keystroke or some such user response.
So, debuggers like XRAY changed the way developers worked and, for many years, have been a key tool which gets used on an everyday basis. It is not without reason that Jack Ganssle once prefixed an article on debugging with “Learn to love your debugger. You’re going to spend a lot of time with it.”
Conventional debugging is sometimes called “Stop and Stare”, because that is what the developer finds themself doing. Commonly staring at a mess, with little idea of where the actual problem occurred. Many modern systems cannot be stopped in a realistic way, as there may be multiple threads on multiple CPUs in the system, instantaneously freezing everything is not possible, and its state would not be meaningful anyway. Surprisingly, the solution is to use techniques that are quite similar to those used in pre-debugger days: tracing of some form or another.
There are broadly 3 ways to trace code execution in an embedded system:
- A hardware solution. By using an appropriate instrument or special on-chip facilities, tracing can be done non-intrusively. This can be an excellent solution for finding certain types of bugs, but comes at a price.
- Instrumentation of the software by hand. This is adding printf() calls, but can be optimized in various ways and may sometimes be a good approach.
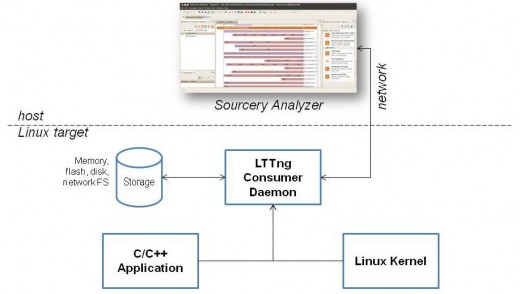
- Instrument the software using LTTng. The approach of using LTTng – Linux Trace Toolkit, next generation – is very effective for larger systems.
I want to think about (2) and (3) a little more …
Historically, a common downside of using printf() calls for debugging was memory. The code for this function is quite complex and is really overkill for this usage. Nowadays, that is likely to be less of a problem, but the time taken to execute a call is more likely to be an issue. Not only is the amount of time very likely to be an issue, but the fact that it is very non-deterministic. One solution is to write some very simple [and easy to measure] debug logging routines that just store to a buffer for later inspection. Here is a crude example:
char log_buffer[LOG_BUFFER_SIZE];
int log_buffer_index=0;
void log_char(char chr)
{
if ((chr == -1) || log_buffer_index = LOG_BUFFER_SIZE))
log_buffer_index = 0;
if (chr != -1)
log_buffer[log_buffer_index++] = chr;
}
void log_string(char *str)
{
while (*str)
log_char(*str++);
}
This “roll your own” approach is OK for simpler systems, but does not scale. Even a moderately complex application needs more. The best approach is like (3) – some simple target code to buffer and send trace data and a sophisticated tool on the host computer to analyze that data.
LTTng fits the bill for many systems, as it has negligible real time impact on the target. Mentor Embedded’s Sourcery Analyzer is ideal for making sense of the vast quantity of trace data. It can offer highly-customizable tracing a profiling capabilities for single core and multicore designs running Linux, Nucleus or on bare metal.
Comments
Leave a Reply
You must be logged in to post a comment.

One of the big advantages of printf (and, I assume, LTTng trace calls) over a completely non-intrusive system like a hardware debugger or even a software debugger is that with printf the compiler helps in making sure that the data you want to look at is actually there to be inspected.
It’s always frustrating to be debugging some code that’s been through a bunch of compiler optimizations and keep seeing “value optimized away” messages when I try to trace through the bug in GDB, so it’s nice to see the “state of the art” in debugging moving towards something that can deal with optimized code like this.
Nice point Brooks.