Less is more only when more is too much in STAR-CCM+ v12.06

The proposition that “less is more”, first penned by Robert Browning back in 1855, has stood the test of time. It has influenced architecture throughout this century and the last and was keenly assessed in a quote from Frank Lloyd Wright, inspiring the title of this blog today. When we model transient phenomena, it’s easy to generate more data than we can practically work with. We’re driven to it by physics – some processes are inherently unsteady (acoustics, external aerodynamics, in-cylinder combustion, mixing,…). If we can’t efficiently understand and communicate our results, more files, consuming more disk space and resources, is definitely no good. So how do we get to less? With STAR-CCM+ v12.06, our Solution History (.simh) capability comes into play once again, making it possible for you to create effective time history plots quickly and easily from your .simh content without having to take the time and effort to re-run your analyses. And that’s just the beginning…
Let’s look at a notional study of a helical blade mixer, using one-way FSI coupling, mixing a highly viscous non-newtonian material. We want to know whether the impeller assembly is going to be strong enough to mix the material without excessively deforming or breaking. To see how much the blade deforms we can use point probes to record displacements (shown at left in the figure below). We have four plots of the Ux vs Uy displacements from the point probe at the very bottom of the impeller. Each plot point corresponds to a single time step.

Plots to the immediate right of the impeller image were generated during the solver run; displacement extents were auto-ranged at each time step. Plots at far right were generated using .simh content, applying displacement extents that spanned the entire time history. Without having already run the analysis, we can’t effectively guess at “appropriate” minimum and maximum plot extents. Consequently, the small displacements we see during the mixer start-up are over-emphasized in the plot generated from the solver run.
Now when we generate the displacement plot during the solver run, it is static with respect to time. Using .simh content, we can animate our plots, or interactively jump between time steps, thereby adding another layer of information. In the side-by-side animated comparison below, we can easily see the trend in the blade displacement orbit much earlier with better time history extents.
We can also generate vertical displacement time history plots from the other point probes using .simh content (shown below).

Now, we did need to do more work here to set up our .simh file. For comparison, this .sim file is 785MB. The .simh file, for 21 point probes, with 4 scalars, stored at 1440 time steps, is 113MB. It’s likely that we’d want to run this transient case on our remote cluster and it’s reasonable to assume that we have a local copy of our .sim file. We can clear any preliminary results and the mesh file from our local copy, reducing its size to 8.8MB. To generate these displacement time history plots, we would only need to transfer the 113MB .simh file from our cluster to our local desktop. That amounts to less time to transfer and less disk space to archive the information we need when compared to having to retrieve and store the full .sim file.
We can also now return the value of other field functions for Minimum and Maximum reports – and this is a general capability in STAR-CCM+ v12.06, not limited to just .simh. For this particular case, we’ve created a .simh file to store just the Von Mises Stress, for every other time step (requiring less disk space), on just the impeller surface. That enables us to return the maximum Von Mises Stress, and its location, anywhere on the impeller.

In the figure above, we can see that the location of the maximum Von Mises Stress, indicated by the magenta-colored sphere, does move around during our mixing operation. This becomes much more apparent in our animation.
To finish things off, we’ll want to try to assess how good this impeller is at mixing. Field monitors let us summarize our data, filtering out short-term fluctuations. We’ll use a running average for our tracer species to try to spot longer term mixing trends. And we’ll use a sliding average field monitor, with a window size matching the number of steps for a complete blade revolution, for the axial velocity component. In the figure below, as the impeller is coming up to speed, we see a small difference in the tracer concentration and a more notable difference in the flow field when comparing instantaneous vs time-averaged results.

At a later time in our analysis, we can see two trends: the continuously averaged tracer highlights areas of slow mixing which can’t be as easily discerned from the instantaneous tracer results, and, the momentum flow field is stabilized – we see no difference between instantaneous and averaged fields.

An animation of these results helps to communicate these trends, but unless you watch it a few times, this is still a lot of data to absorb. We still need less!
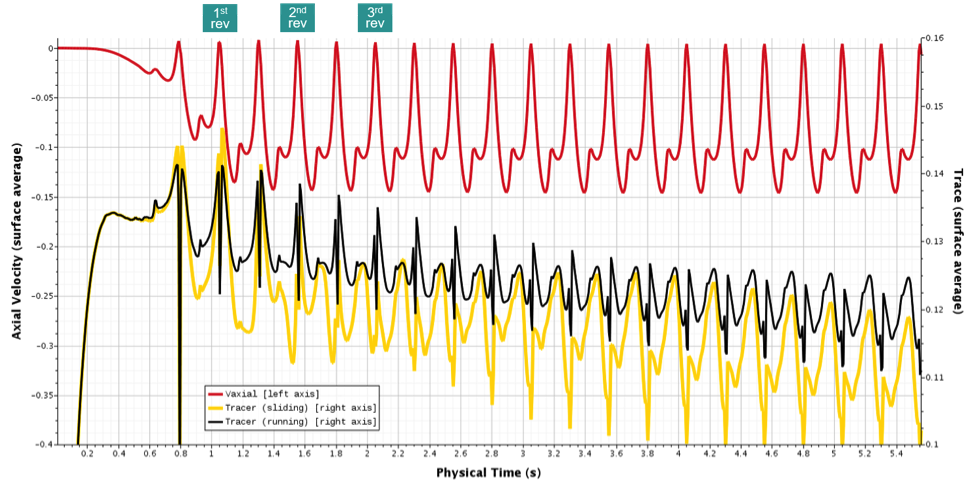
Now let’s imagine the scenario where your manager is going to be presenting the results of this design to decision makers. That group will be looking for a high-level summary and you’ve been asked you to provide a summary of the trends by this afternoon. We’ve got our .simh data saved and we have no time to re-run the analysis. But with v12.06, we can generate that summary in minutes by averaging in space and time. In the plot below, the red line shows the sliding window time average for the axial velocity, averaged spatially, on the cutting plane. The peaks correspond to the triangular flat section of the impeller blade passing thru the cutting plane; the first 3 complete blade revs are indicated above the plot. The black and yellow lines are the spatial averages of the tracer concentration on the cutting plane for each time step. The black line uses running time average; the yellow line uses the sliding window time average. We can see in just this single plot that the flow field stabilizes with respect to time pretty quickly and that the mixing trend while moving towards the expected volume averaged result, will still take several more blade revolutions to become well mixed.

It’s true that setting up and working with .simh takes more time and effort than just running a transient case, one time. What you get in return is a demonstrable reduction in your time to confidently assess the data and in the resources, you need to fully comprehend and effectively communicate your results. The Solution History story doesn’t stop here. It continues to be the cornerstone of our transient data analysis capability and more enhancements are planned. Stay tuned and please let us know your thoughts on how we can continue to improve.


