Better design decisions for your CFD simulations with surrogate models

Life, Lockdown and Lego! The pandemic has meant extra time at home for all of us. Some have taken up ambitious new projects to keep themselves busy (How motivated are you anyway?). Others, like me, have found time to take a trip down memory lane and nostalgia avenue. And what did I find? My old Legos, still intact, at my parents’ place.
I remembered the creativity and challenges that emanated from them. But with my scientific vision now, I was more impressed by the accuracy of their manufacturing process. Never an issue interlocking them, even with the craziest ideas I could imagine. Indeed, Lego’s designs are known to be very robust and reliable with tiny manufacturing tolerances. This might sound easy to achieve, but in the real world, that’s a real engineering challenge!
Lego’s machines have an incredible precision tolerance of around 0.002 millimeters. The blocks need to fit with every block made for the last 54 yrs.
The need for surrogate models
Engineers today need to be confident in their simulated design to increase product robustness and reliability. Tolerances can make or break manufacturing processes and need to be considered early in the design process. But this is not an easy task. It requires thousands of simulations to extract the right trends and sensitivities.
In Simcenter STAR-CCM+ 2021.1, we introduce surrogate models (also known as response surface models or RSM) for your computational fluid dynamics (CFD) simulations.
Now you can predict the performance of thousands of variants without the need to perform real CFD simulations. This helps assess the sensitivity of a design with respect to its geometric parameters or boundary conditions to understand how robust it will be from a manufacturing or operational standpoint.
Design sensitivity of a gas turbine
Robustness and reliability studies are typically considered after an optimization study. This is to ensure that the best performing design is also the best one from a production perspective. However, such analysis can also be helpful to assess a product sensitivity against multiple uncertain operating conditions to assess the associated risks.
Let’s take the example of gas turbines. These are complex systems developed at very high costs to generate power for our personal or professional use. The life of a gas turbine is a non-stop marathon. Sensitivities to operating conditions affect the performance of the living plant. Robustness analysis here will definitely help lower the emissions while powering more homes.
One MW can power 650 houses in the USA. That means that a large 500MW gas turbine can power 325,000 homes. A one percent loss in efficiency would mean 3000 fewer houses supplied!
Surrogate models for a compressor
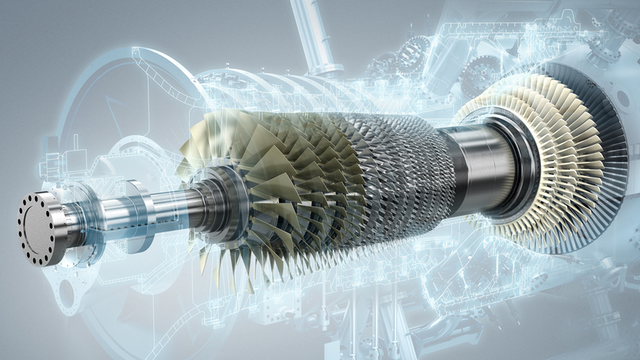
The compressor is a key part of a gas turbine. It is made of many interconnected rows. To get the right prediction of the part life duration, it’s critical to predict the right turbulence inlet conditions between each row.
But it’s also crucial to assess how sensitive the performance of the system will be with respect to these predictions. Up to now, this was done based on experience. With surrogate models now in Simcenter STAR-CCM+, you have a tool that helps assess these critical sensitivities!
In the video above, we simulated a compressor row in Simcenter STAR-CCM+. Then, we used Design Manager to create a design of experiments study with 40 sampling points. Our input parameters here are the surface roughness, the turbulence intensity and the turbulence length scale. With this database of points, we created a surrogate model for each of the four responses represented in the image below.
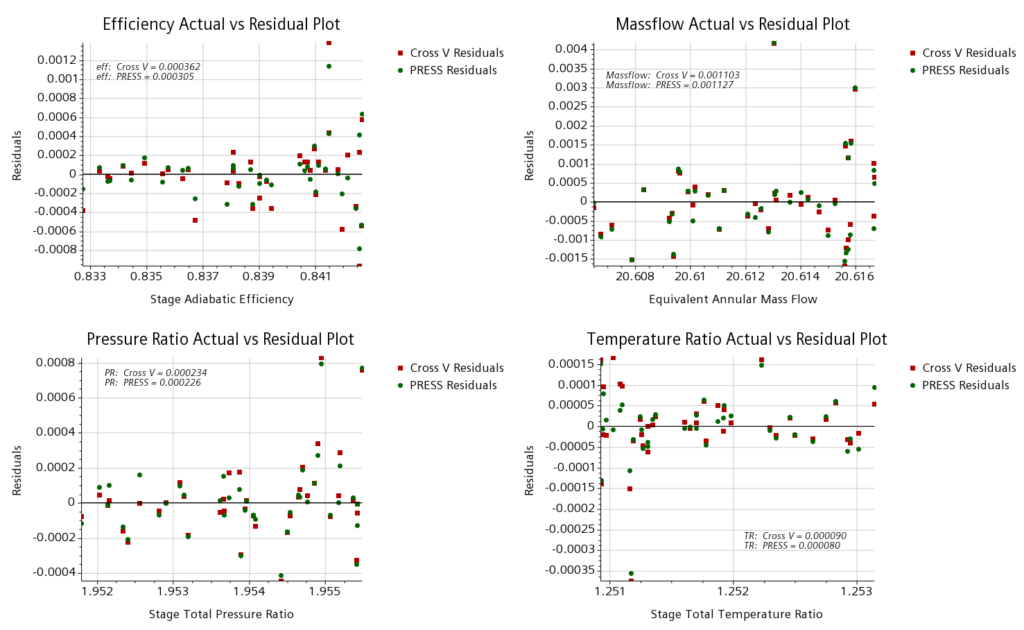
These models approximate the objective function by fitting a mathematical function to a database of calculated points. They are then used to instantaneously predict non-simulated variants. In Figure 1, we can compare the difference between the actual simulated results and the predicted ones by our surrogate models to assess the model accuracy.
The Cross V and PRESS coefficients give us an average of the error to assess if our model is reliable enough or needs more refinement. For example, low PRESS values compared to min/max responses values indicate a high model accuracy. In our case, we can see that the PRESS values represent, for example, 0.036% of the highest efficiency value. Our surrogate model is reliable.
Robustness study to assess sensitivity
Now that we ensured proper surrogate models accuracy, we can use them for a robustness study. This is to assess the responses’ sensitivities with respect to the input parameters. Figure 2 shows the probability distribution plots for all responses. Here, 25,000 values are evaluated by the surrogate models and distributed in their proper bins so that we can visualize the global distribution.
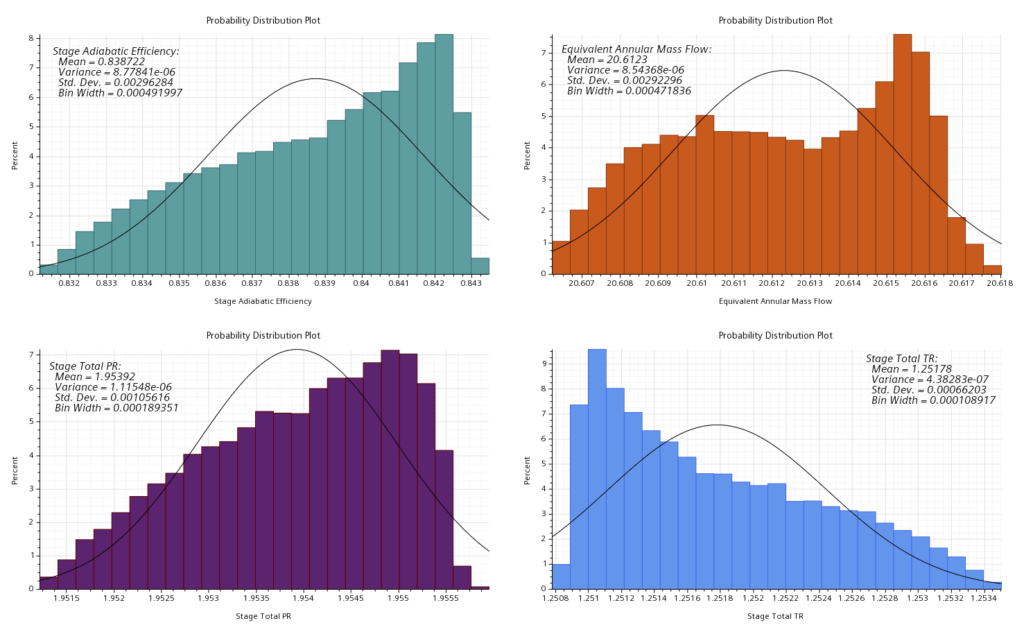
The standard deviation indicates how sensitive the system is. A low standard deviation indicates a high system robustness. For the stage adiabatic efficiency, the standard deviation of 0.00296 (representing a +/-0.7% variance) is quite good from a statistical standpoint. But for a turbomachinery expert who might be chasing a sensitivity lower than 0.5%, the uncertainty on the boundary conditions in this case can impact engineering decisions. The robustness analysis will help better understand the impact of these uncertainties to adjust the system.
What does this all mean? Well, a solution could be to constrain it more. For example, we could reduce the tolerance of the input parameters like the surface roughness. A lower variation could potentially reduce the system response sensitivity and help us hit the 0.5% target. However, this might impact the manufacturing costs so it’s always a trade-off between performance and cost. From the other plots, the other responses are quite insensitive to the parameter changes, which is a valuable quantitative information for the user.
Surrogate models for a dual pump transmission system
Surrogate models can also help engineers to quickly predict new variants by exploiting existing databases of results. This is a way to leverage all the accumulated data that your organization has capitalized or characterize 3D components in 0D/1D simulations where turnaround time is critical.
Let’s take the example of a dual pump transmission system simulated in Simcenter Amesim. A mechanical oil pump works in conjunction with an electrical auxiliary oil pump. When the mechanical oil pump is switched off, a flapper valve protects the auxiliary oil pump from damage caused by back pressure. To understand the impact of the valve dynamics on the transmission system, 3D simulation is required for the flapper valve. The following picture illustrates the original transmission circuit of the dual pump system including the 1D flapper valve component:
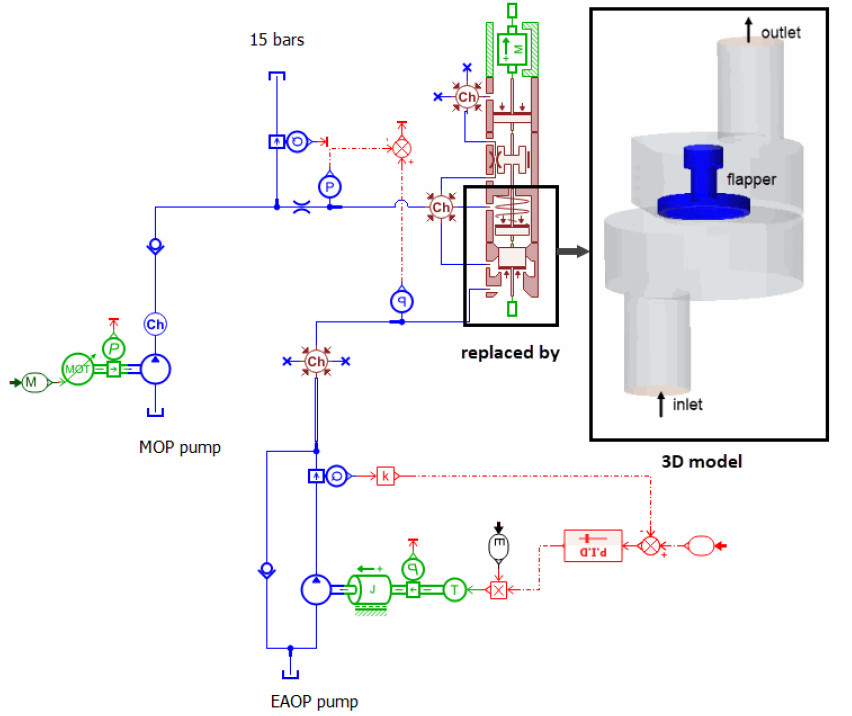
Traditionally, engineers would rely on 1D/3D co-simulation to solve such a problem, but the CFD turnaround time is often an obstacle for the 1D simulation engineer targeting fast throughput. With Design Manager, you can now compute a surrogate model for each response of this flapper valve component and export them as a Functional Mockup Unit (FMU) to be integrated in the 1D simulation. The video below illustrates this process.
Quickly predict performance of thousands of design variants in your CFD simulation
Tolerance issues are everywhere around us and even if they might seem negligible, they might actually be catastrophic for your design performance. Simcenter STAR-CCM+ and its surrogate models can now help CFD engineers better assess those risks early in the design process to make better design decisions. Companies like Lego seem to have understood this concept a while ago as the robustness of their product is unquestionable. And as Engineers, Lego’s incredible tolerance robustness can serve as an inspiration for our designs.
For more information on Design Manager in Simcenter STAR-CCM+:
- How to run 55 ship designs in 45 mins on AWS?
- From design exploration to design thinking in 100s of simulations
______________________________________________________________________________

