Thermal Bottlenecks. This is Hot, This is Why.
There are 475,000 Google search hits for ‘thermal bottleneck’. It’s a well recognised phrase playing on a very obvious analogy. Despite this there were few attempts to quantify such a parameter. Spurred on by its relevance in electronic thermal design, we did just that, put hard numbers to the concept. FloTHERM now has the ability to plot distributions of thermal bottleneck, enabling thermal design engineers to predict not just how hot a product might become in operation, but also the culprit locations that cause that temperature rise.
When determining how to quantify a thermal bottleneck we knew that it should combine both the amount of heat that flows as well as the difficulty the heat experiences as it flows. The amount of heat flowing is simply the heat flux, W/m^2. The difficulty was a little more difficult to figure out. In the end we selected the temperature gradient as being indicative of the difficulty. The bigger the temperature difference, the more the difficulty experienced that gave rise to that dT/dx. Both are vector quantities. How best to combine both? (a lot of heat flowing AND finding it difficult). Dot product seemed best. Finally normalised by its maximum to show the relative distributions in a single simulation model. And that was the invention process, full details can be found in US patent US8628236.
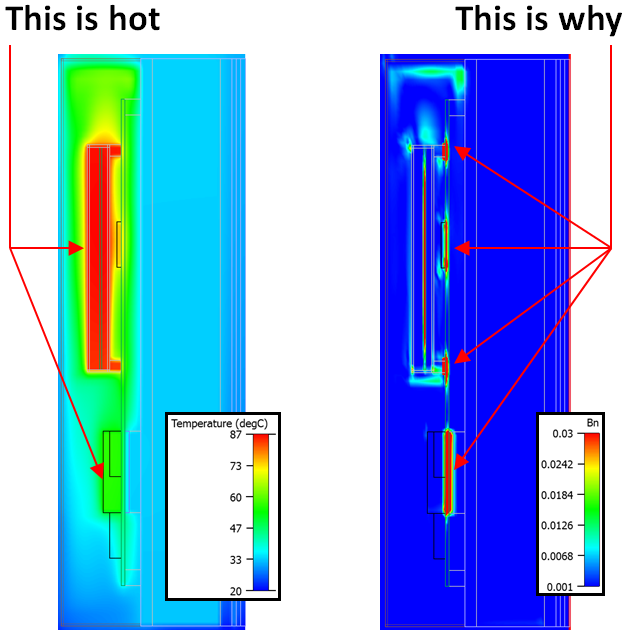
Take a section through a typical FloTHERM application (in this case a wall mounted repeater unit):
On the left is temperature. On the right is thermal bottleneck, Bn. Showing clearly where the bottlenecks are makes for a compelling demonstration as to why design changes might be needed, and where. Much design work comes down to influence and balance. Having such a Bn capability is a useful influencing tool for the thermal design engineer.
Analogies have always played an important role in the evolution of science and technology. As Einstein said: “Growth comes through analogy; through seeing how things connect, rather than only seeing how they might be different.” It was therefore rather gratifying when we discovered that the thermal bottleneck is analogous to the Joule heating power density in a DC current flow (current density x voltage gradient). W/m^3 compared to the thermal bottleneck degC W/m^3. If Joule heating is the energy required to force the current through where its flowing, then bottleneck is the energy required to get the heat over a 1 degC hurdle. Neat.
You can find out more details in this webinar I gave on this subject.
28th October 2014, Hampton Court.
