The Challenge of Getting High Quality Reports out of PLM

Over the last few years report, creation applications have significantly improved their ease of use. Users can very quickly create visually exciting reports with clean layouts allowing fast analysis of the data. This has led to a new realm of applications focused on data discovery and self-service reporting. The most critical component to these applications is their ability to extract quality data, that you can trust, to ensure that you’re making sound business decisions.
Product Lifecycle Management (PLM) data is complex due to the variability of the data, the dependency of intelligent relationships between data elements, and the timeframe of the information. This presents a unique challenge for reporting applications.
Variability
One of the primary goals of most organizations implementing PLM is configuration management for their products’ bill of material (BOMs). The BOM is usually defined dynamically based on the way a specific user wants to see it (latest working, released, manufactured, as-built, variants & options, date effectivity, etc.). To compound this, the BOMs are constantly evolving; large structures may have dozens or even hundreds of changes happening every day.
The reporting application must both understand the context and desired configuration of the BOM it is reporting on. This will ensure the user is working with correct data and therefore can rely on and trust the insight that the report provides.
Based on the desired use of the report, the configuration of the product structure is typically defined on-demand to show its applicable components. This is where replication of data into an offline data warehouse for reporting can offer a challenge. The offline system will need to store either many set configurations of all the product BOMs based on the anticipated requests or only a sample configuration of the BOM.
This confines the report designers and users to only view pre-defined configurations which may not provide the details that they need to gain insight.
Relationships
PLM systems use relationships between objects to define the meaning and intent of the data. For example, a common request in PLM is for a report to show how many problem reports and change notices are opened against a specific BOM. A manufacturer will do this to understand the status of the project, the quality of the components, and their potential impact on delivery timelines.
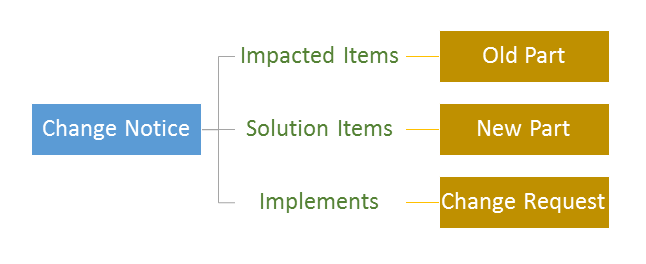
The image above shows the objects that are required and the relationships to understand the data to build such a report. To provide this data back to the reporting application, the system needs to find the parts that are in the BOM, then for these parts to find any attached problem reports or change notices and finally find related parts required by the pending changes.

From the example above, you can see that the relationships (green) between the change notice and the business objects (gold boxes) are essential to the overall intent of the information. The reporting application needs to be able to differentiate between an “Impacted Item” and a “Solution Item” as the intention of these two items is very different, and if not handled properly in the report data model, the resulting reports will be incorrect.
Therefore a simple flat Online Analytical Processing (OLAP) cannot handle this type of information without designing a data model that can understand the meaning of these relations.
Up to Date Information
Lastly, the types of reports that most organizations need for PLM are based on internal operations, projects statuses, and design readiness. Users usually are looking to see changes to a project immediately to understand their impact and effect. For example, project status dashboards are a common area that the designers, engineers, and project managers use to review their progress in daily meetings and reviews. With designs quickly changing and impacting suppliers and manufacturing schedules, these changes can negatively impact the cost of business. These dashboards typically require current up-to-date information; however, the data warehouses are usually only updated incrementally at off-peak times. This means users have to wait for the next refresh of the data warehouse to get the most up-to-date information needed for the report. These delays reduce user’s confidence in the report.
The reporting system must be able to retrieve the most up-to-date information in a timely manner to allow for these impromptu reports and the latest status requests.
Better Decisions
The most important part of reporting is to ensure that you can trust the data so that you can rely on the intelligence that you gain from it. The only way to ensure that the data being retrieved by the reporting application is reliable is to access it through the PLM system’s business rules. This way you can make the better decisions you are looking for. When implementing a reporting strategy with PLM these factors need to be considered, to understand if they will reduce the quality of the data and impact the validity of the reports.
A reporting strategy that relies only on the speed of report creation will only lead to faster answers that cannot be trusted. The architecture has to be fully understood and properly implemented to ensure quality results.
Teamcenter Reporting and Analytics addresses these challenges and allows you to get high-quality reports out of PLM.


