Part 2: The 2012 Wilson Research Group Functional Verification Study
Design Trends (Continued)
In Part 1 of this series of blogs, I focused on design trends (click here) as identified by the 2012 Wilson Research Group Functional Verification Study (click here). In this blog, I continue presenting the study findings related to design trends, with a focus on embedded processor, DSP, and on-chip bussing trends.
Embedded Processors
In Figure 1, we see the percentage of today’s designs by the number of embedded processor cores. It’s interesting to note that 79 percent of all non-FPGA designs (in green) contain one or more embedded processors and could be classified as an SoC, which are inherently more difficult to verify than designs without embedded processors. Also note that 55 percent of all FPGA designs (in red) contain one or more embedded processors. 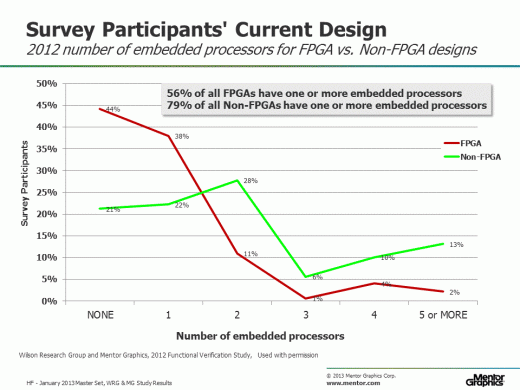
Figure 1. Number of embedded processor cores
Figure 2 shows the trends in terms of the number of embedded processor cores for non-FPGA designs. The comparison includes the 2004 Collett study (in dark green), the 2007 Far West Research study (in gray), and the 2010 Wilson Research Group study (in green). 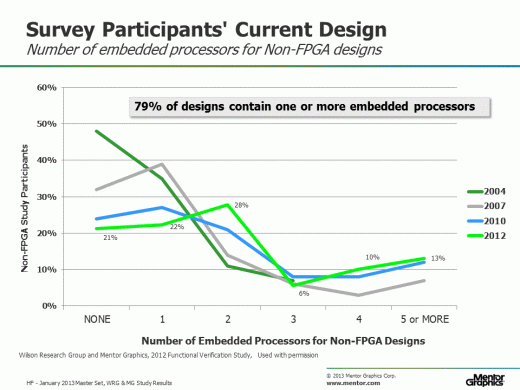
Figure 2. Trends: Number of embedded processor cores
For reference, between the 2010 and 2012 Wilson Research Group study, we did not see a significant change in the number of embedded processors for FPGA designs. The results look essentially the same as the red curve in Figure 1.
Another way to look at the data is to calculate the mean number of embedded processors that are being designed in by SoC projects around the world. In Figure 3, you can see the continual rise in the mean number of embedded processor cores, where the mean was about 1.06 in 2004 (in dark green). This mean increased in 2007(in gray) to 1.46. Then, it increased again in 2010 (in blue) to 2.14. Today (in green) the mean number of embedded processors is 2.25. Of course, this calculation represents the industry average—where some projects are creating designs with many embedded processors, while other projects are creating designs with few or none.
It’s also important to note here that the analysis is per project, and it does not represent the number of embedded processors in terms of silicon volume (i.e., production). Some projects might be creating designs that result in high volume, while other projects are creating designs with low volume. 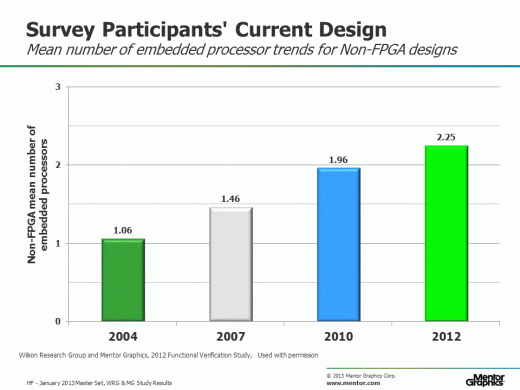
Figure 3. Trends: Mean number of embedded processor core
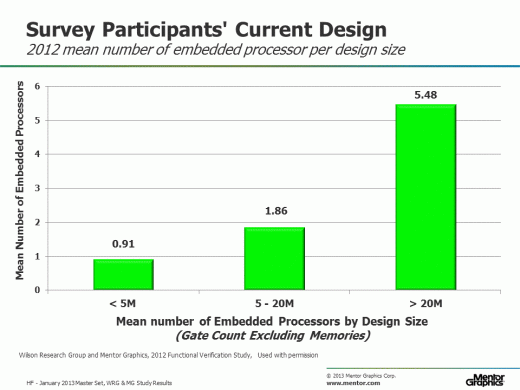
Another interesting way to look at the data is to partition it into design sizes (for example, less than 5M gates, 5M to 20M gates, greater than 20M gates), and then calculate the mean number of embedded processors by design size. The results are shown in Figure 4, and as you would expect, the larger the design, the more embedded processor cores.
Figure 4. Non-FPGA mean embedded processor cores by design size
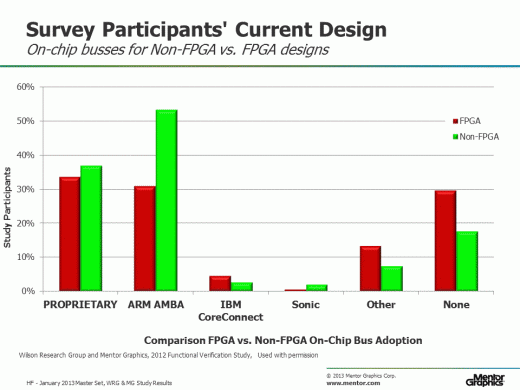
Platform-based SoC design approaches (i.e., designs containing multiple embedded processor cores with lots of third-party and internally developed IP) have driven the demand for common bus architectures. In Figure 5 we see the percentage of today’s designs by the type of on-chip bus architecture for both FPGA (in red) and non-FPGA (in green) designs.
Figure 5. On-chip bus architecture adoption
Figure 6 shows the trends in terms of on-chip bus architecture adoption for Non-FPGA designs. The comparison includes the 2007 Far West Research study (in gray), the 2010 Wilson Research Group study (in blue), and the 2012 Wilson Research Group study (in green). Note that there was about a 250 percent reported increase in Non-FPGA design projects using the ARM AMBA bus architecture between the years 2007 and ??. 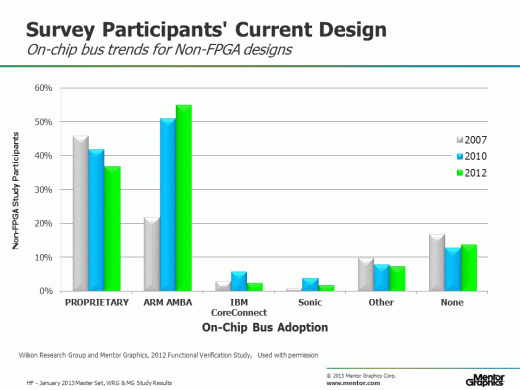
Figure 6. Trends: Non-FPGA on-chip bus architecture adoption
Figure 7 shows the trends in terms of on-chip bus architecture adoption for FPGA designs. The comparison includes the 2010 Wilson Research Group study (in pink), and the 2012 Wilson Research Group study (in red). Note that there was about a 163 percent increase in FPGA design projects using the ARM AMBA bus architecture between the years 2010 and 2012. 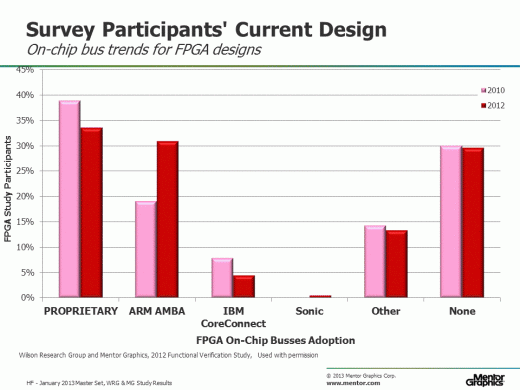
Figure 7. FPGA on-chip bus architecture adoption trends
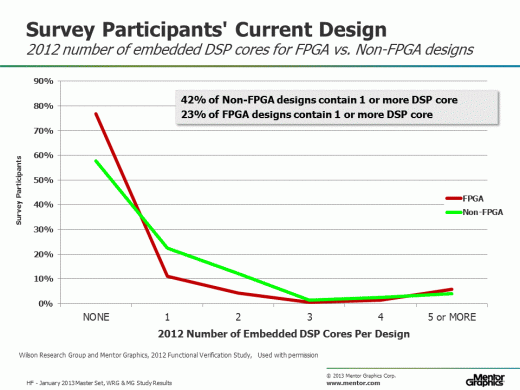
In Figure 8 we see the percentage of today’s designs by the number of embedded DSP cores for both FPGA designs (in red) and non-FPGA designs (in green).
Figure 8. Number of embedded DSP cores
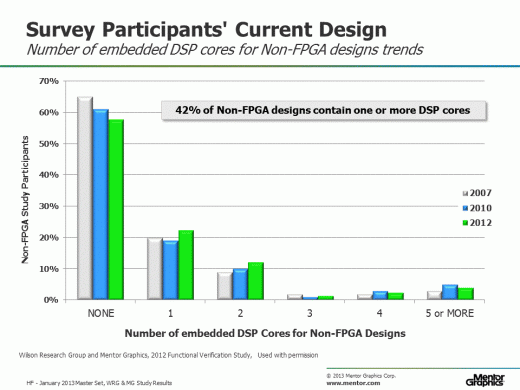
Figure 9 shows the trends in terms of the number of embedded DSP cores for non-FPGA designs. The comparison includes the 2007 Far West Research study (in grey), the 2010 Wilson Research Group study (in blue), and the 2012 Wilson Research Group study (in green).
Figure 9. Trends: Number of embedded DSP core
In my next blog (click here), I’ll present clocking and power trends.


Comments