Part 3: The 2012 Wilson Research Group Functional Verification Study
Clocking and Power Trends
In Part 2 of this series of blogs, I continued the discussion focused on design trends as identified by the 2012 Wilson Research Group Functional Verification Study. In this blog, I continue presenting the study findings related to design trends, with a focus on clocking and power trends.
Independent Asynchronous Clock Domains
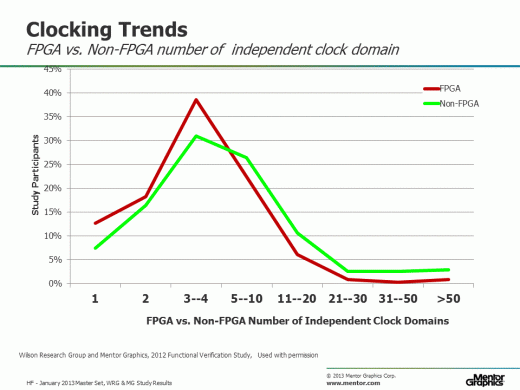
Figure 1 shows the percentage of designs developed today by the number of independent asynchronous clock domains. The asynchronous clock domain data for FPGA designs is shown in red, while the data for the non-FPGA designs is shown in green.
Figure 1. Number of independent asynchronous clock domains
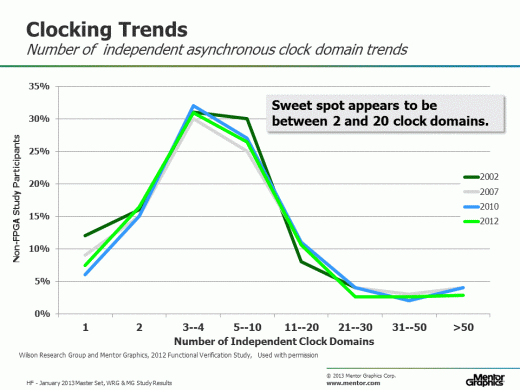
Figure 2 shows the trends in number of independent asynchronous clock domains for non-FPGA designs. The comparison includes the 2002 Collett study (in dark green), the 2007 Far West Research study (in gray), the 2010 Wilson Research Group study (in blue), and the 2010 Wilson Research Group study (in green).
Figure 2. Trends: Number of independent asynchronous clock domain
It’s interesting to note that, although the number of clock domains is increasing over time, the sweet spot in terms of number of independent asynchronous clock domains seems to remain between 2 and 20, and it hasn’t changed significantly in the past ten years.
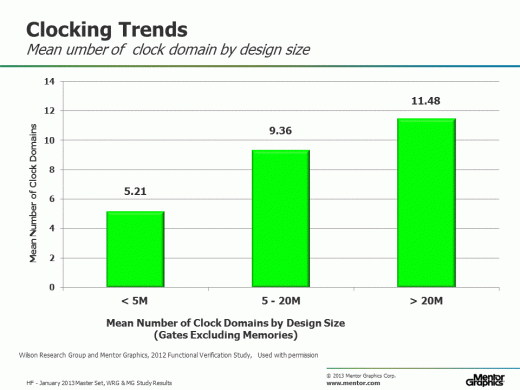
Figure 3 provides a different analysis of the data by partitioning the projects by design sizes, and then calculating the mean number of independent asynchronous clock domains by project design. The design size partitions are represented as: less than 5M gates, 5M to 20M gates, and greater than 20M gates.
Figure 3. Mean number of independent clock domains by design size
Power Management
Today, we see that about 67 percent of design projects actively manage power with a wide variety of techniques, ranging from simple clock-gating, to complex hypervisor/OS-controlled power management schemes. We decided for the 2012 Wilson Research Group study that we wanted to take a closer look at power management related to functional verification. Hence, I can share some interesting results with you here. However, since this aspect of functional verification has never been studied in previous surveys, I will not be able to show trends. Our goal is to carry these same questions forward in our future studies so that we can identify trends.
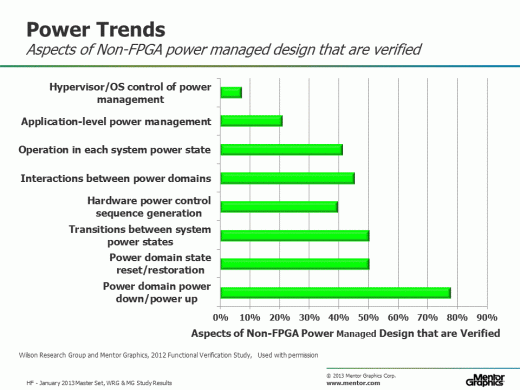
For these, Figure 4 shows the various aspects of their power-managed design that they verify (for those 67 percent of design projects that actively manage power).
Figure 4. Aspects of power-managed design that are verified
In our study, we asked what percentage of simulation was power-aware (that is, verifying some functional aspect of the power-management scheme), and the results are shown in Figure 5. We were surprised to learn that about 10 percent of all designs that actively manage power perform no power-aware simulation to verify the power management scheme.
Figure 5. Percentage of simulation that verified some aspect of power management
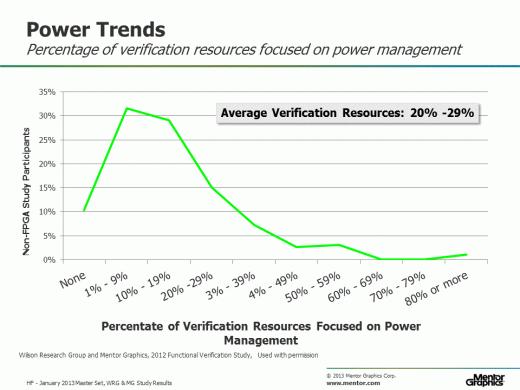
In addition, we asked what percent of verification resources were focused on power management verification, and the results are shown in Figure 6. You will note that the curve is very similar to the percentage of total simulations that were power-aware, which you would expect. Again, we see that about 10 percent of the projects that actively manage power provide no verification resources to verify the power-management scheme.
Figure 6. Percentage of verification resources focused on power management
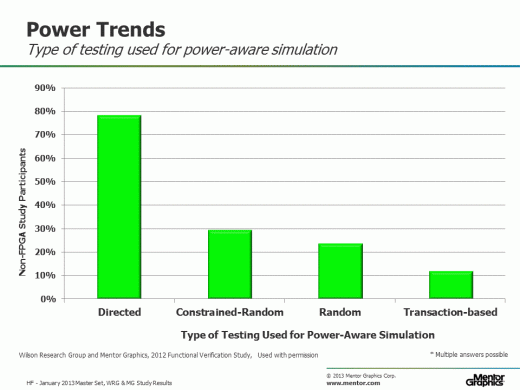
Figure 7 shows the different types of simulation-based functional testing approaches that are currently applied to verifying power management. It’s not a surprise that most power-aware simulation is based on directed-testing approaches since often (but not always) power-aware simulations are performed at the SoC integration level where directed testing is common.
Figure 7. Percentage of simulation that verified some aspect of power management
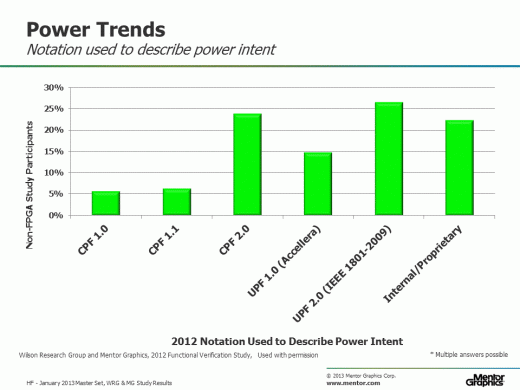
Since the power intent cannot be directly described in an RTL model, alternative supporting notations have recently emerged to capture the power intent. In the 2012 study, we wanted to get a sense of where the industry stands in adopting the notation. For projects that actively manage power, Figure 8 shows the various notations that have been adopted to describe the power intent. Some projects are actively using multiple standards (such as different versions of UPF or a combination of CPF and UPF). That’s why the adoption results do not sum to 100 percent.
Figure 8. Notation used to describe power intent
In my next blog I’ll present data on design and verification reuse trends.



Comments