Part 4: The 2012 Wilson Research Group Functional Verification Study
Reuse Trends
This blog is a continuation of a series of blogs that present the highlights from the 2012 Wilson Research Group Functional Verification Study (click here). In my previous blog (click here), I focused on clocking and power management. In this blog, I focus on design and verification reuse trends. As I mentioned in my prologue blog to this series (click here), one interesting trend that emerged from the study is that reuse adoption is increasing.
Design Composition Trends
Figure 1 shows the mean design composition trends graph, which compares the 2007 Far West Research study (in blue) with the 2012 Wilson Research Group study (in green).
New logic development has decreased by 34 percent in the last five years, while external IP adoption has increased by 69 percent. This increase in adoption has been driven by IP demand required for SoC development, such as embedded processor cores and standard interface cores. 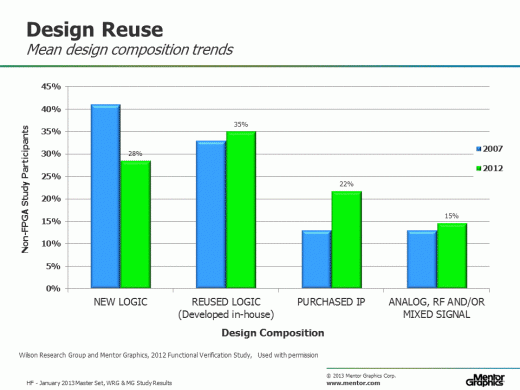
Figure 1. Mean design composition trends
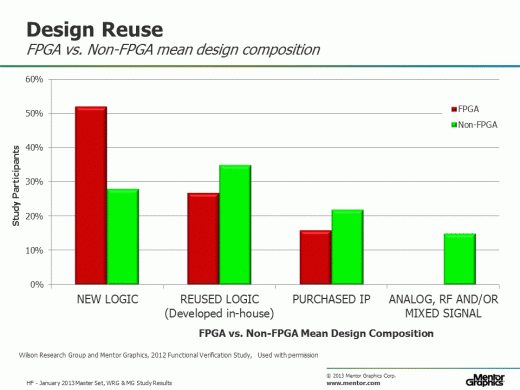
Figure 2 compares today’s design composition between FPGA designs (in red) with Non-FPGA designs (in green). Currently, more new designs (i.e., new RTL) are created for FPGA versus Non-FPGA designs. However, as FPGAs get larger in terms of transistors, reuse will become even more important to address the design productivity gap that could arise between the number of transistors that can be manufactured on an FPGA and the amount of time to design for a given project.
Figure 2. Mean composition comparison between FPGA and Non-FPGA designs.
Verification Testbench Composition Trends
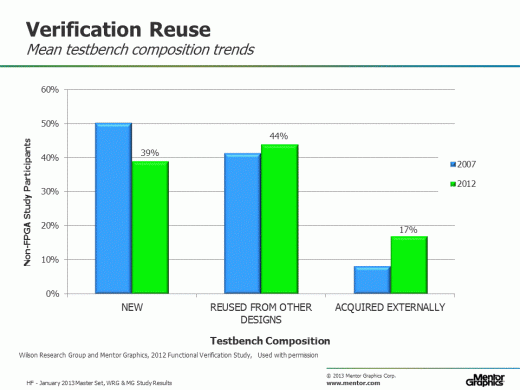
Figure 3 shows the mean testbench composition trends graph, which compares the 2007 Far West Research study (in blue) with the 2012 Wilson Research Group study (in green).
Notice that new verification code development has decreased by 24 percent in the last three years, while external verification IP adoption has increased by 138 percent. This increase has been driven by the emergence of standard on-chip and off-chip bus architectures.
Figure 3. Mean testbench composition trends
Figure 4 compares today’s testbench composition between FPGA (in red) and Non-FPGA (in green) designs. Again, we see that more new code is written today for FPGA than Non-FPGA testbenches, and I expect this will change over time to be more in line with Non-FPGA designs. 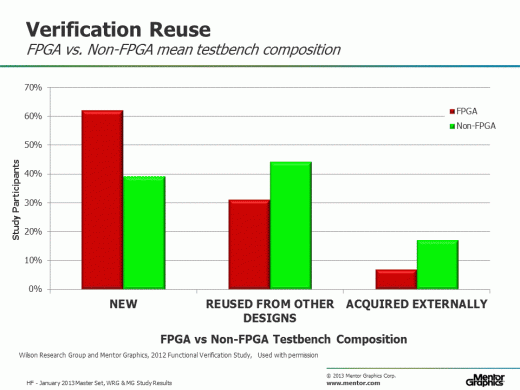
Figure 4. Mean testbench composition comparison between FPGA and Non-FPGA designs
In my next blog (click here), I’ll shift my focus from design trends to project resource trends. I’ll also present our findings on the project effort spent in verification.


Comments