Part 7: The 2012 Wilson Research Group Functional Verification Study
Testbench Characteristics and Simulation Strategies
This blog is a continuation of a series of blogs that present the highlights from the 2012 Wilson Research Group Functional Verification Study (for background on the study, click here).
In my previous blog (click here), I focused on the controversial topic of effort spent in verification. In this blog, I focus on some of the 2012 Wilson Research Group findings related to testbench characteristics and simulation strategies. Although I am shifting the focus away from verification effort, I believe that the data I present in this blog is related to my previous blog and really needs to be considered when calculating effort.
Time Spent in full-chip versus Subsystem-Level Simulation
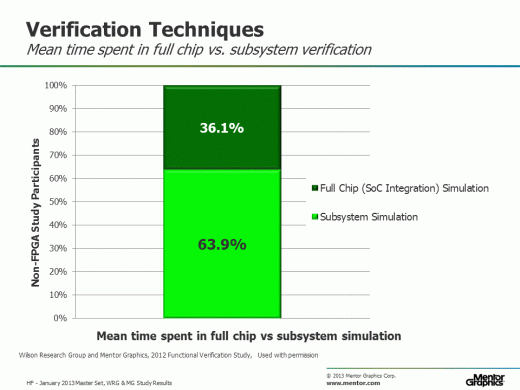
Let’s begin by looking at Figure 1, which shows the percentage of time (on average) that a project spends in full-chip or SoC integration-level verification versus subsystem and IP block-level verification. The mean time performing full chip verification is represented by the dark green bar, while the mean time performing subsystem verification is represented by the light green bar. Keep in mind that this graph represents the industry average. Some projects spend more time in full-chip verification, while other projects spend less time.
 Figure 1. Mean time spent in full chip versus subsystem simulation
Number of Tests Created to Verify the Design in Simulation
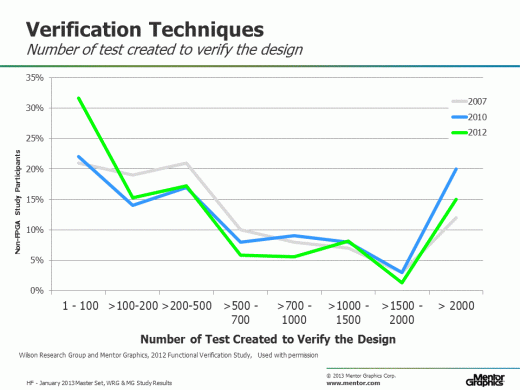
Next, let’s look at Figure 2, which shows the number of tests various projects create to verify their designs using simulation. The graph represents the findings from the 2007 Far West Research study (in gray), the 2010 Wilson Research Group study (in blue), and the 2012 Wilson Research Group study (in green). Note that the curves look remarkably similar over the past five years. The median number of tests created to verify the design is within the range of (>200 – 500) tests. It is interesting to see a sharp percentage increase in the number of participants who claimed that fewer tests (1 – 100) were created to verify a design in 2012. It’s hard to determine exactly why this was the case—perhaps it is due to the increased use of constrained random (which I will talk about shortly). Or perhaps there has been an increased use of legacy tests. The study was not design to go deeper into this issue and try to uncover the root cause. This is something I intend to informally study this next year through discussions with various industry thought leaders.
Figure 2. Number of tests created to verify a design in simulation
Percentage of Directed Tests versus Constrained-Random Tests
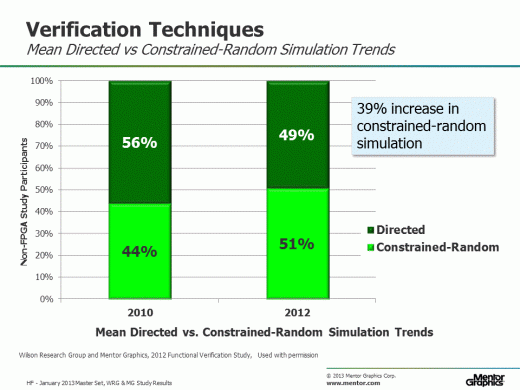
Now let’s compare the percentage of directed testing that is performed on a project to the percentage of constrained-random testing. Of course, in reality there is a wide range in the amount of directed and constrained-random testing that is actually performed on various projects. For example, some projects spend all of their time doing directed testing, while other projects combine techniques and spend part of their time doing directed testing—and the other part doing constrained-random. For our comparison, we will look at the industry average, as shown in Figure 3. The average percentage of tests that were directed is represented by the dark green bar, while the average percentage of tests that are constrained-random is represented by the light green bar.
Figure 3. Mean directed versus constrained-random testing performed on a project
Notice how the percentage mix of directed versus constrained-random testing has changed over the past two years.Today we see that, on average, a project performs more constrained-random simulation. In fact, between 2010 and 2012 there has been a 39 percent increase in the use of constrained-random simulation on a project. One driving force behind this increase has been the maturing and acceptance of both the SystemVerilog and UVM standards—since two standards facilitate an easier implementation of a constrained-random testbench. In addition, today we find that an entire ecosystem has emerged around both the SystemVerilog and UVM standards. This ecosystem consists of tools, verification IP, and industry expertise, such as consulting and training.
Nonetheless, even with the increased adoption of constrained-random simulation on a project, you will find that constrained-random simulation is generally only performed at the IP block or subsystem level. For the full SoC level simulation, directed testing and processor-driven verification are the prominent simulation-based techniques in use today.
Simulation Regression Time
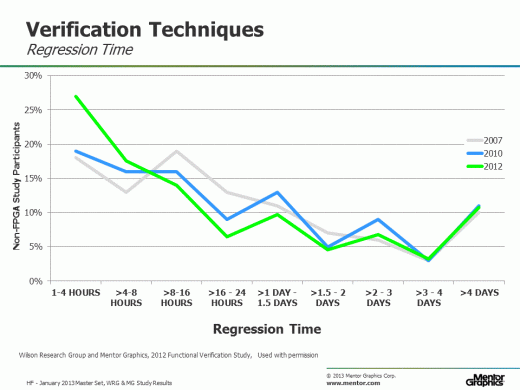
Now let’s look at the time that various projects spend in a simulation regression. Figure 4 shows the trends in terms of simulation regression time by comparing the 2007 Far West Research study (in gray) with the 2010 Wilson Research Group study (in blue), and the 2012 Wilson Research Group study (in green). There really hasn’t been a significant change in the time spent in a simulation regression within the past three years. You will find that some teams spend days or even weeks in a regression. Yet today, the industry median is between 8 and 16 hours, and for many projects, there has been a decrease in regression time over the past few years. Of course, this is another example of where deeper analysis is required to truly understand what is going on. To begin with, these questions should probably be refined to better understand simulation times related to IP versus SoC integration-level regressions. We will likely do that in future studies—with the understanding that we will not be able to show trends (or at least not initially).
 Figure 4. Simulation regression time trends
In my next blog (click here), I’ll focus on design and verification language trends, as identified by the 2012 Wilson Research Group study.


Comments