Conclusion: The 2016 Wilson Research Group Functional Verification Study
Deeper Dive into First Silicon Success and Safety Critical Designs
This blog is a continuation of a series of blogs related to the 2016 Wilson Research Group Functional Verification Study (click here). In my previous blog (click here), I presented verification results in terms of schedules, number of required spins, and classification of functional bugs. In this blog, I conclude the series by having a little fun with some of the findings from our recent study.
You might recall from our 2014 study we did a deeper dive into the findings made a non-intuitive observation related to design size and first silicon success. That is, the smaller the design the less likelihood of achieving first silicon success (see 2014 conclusion blog for details). This observation still holds true in 2016.
For our 2016 study, we decided to do a deeper dive related to the following:
- Verification maturity and silicon success, and
- Safety critical designs and silicon successes.
Verification Maturity and Silicon Success
Figure 1 presents the findings for ASIC/IC first silicon success, and Figure 2 presents the findings for FPGA non-trivial bug escapes into production. It is important to note that only 33 percent of ASIC/IC projects are able to achieve first silicon success, and only 22 percent of FPGA projects go into production without a non-trivial bug.
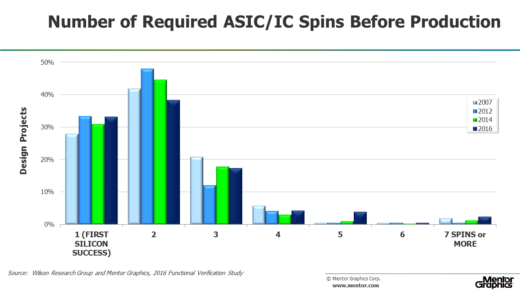
Figure 1. ASIC/IC required spins before final production
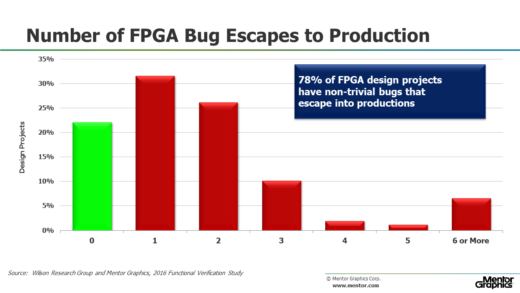
Figure 2. FPGA non-trivial bug escapes into production
A question worth asking is if there might be some correlation between project success (in terms of preventing bugs) and verification maturity. To answer this question we looked at verification technology adoption trends related to a project’s silicon success.
Figure 3 presents the adoption of various verification techniques related to ASIC/IC projects, and then correlates these results against achieving first silicon success. The data suggest that the more mature an ASIC/IC project is in its adoption of verification technology the more likelihood of achieving first silicon success.
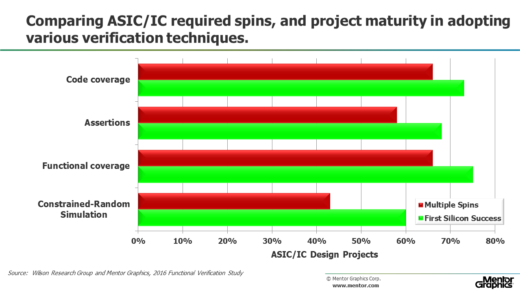
Figure 3. ASIC/IC spins and verification maturity.
Similarly, in Figure 4 we examine the adoption of various verification techniques on FPGA projects, and then correlate these results against preventing non-trivial bug escapes into production. Again, the data suggest that the more mature an FPGA project is in its adoption of verification technology the more likelihood that a non-trivial bug will not escape into production.
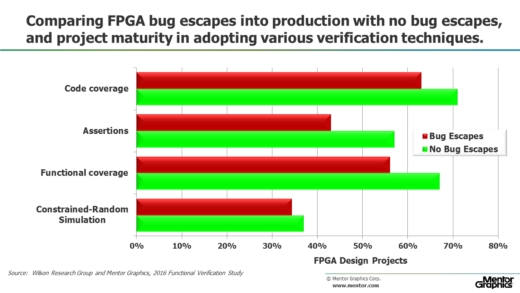
Figure 4. FPGA non-trivial bug escapes into production and verification maturity.
Safety Critical Designs and Silicon Success
The second aspect of our 2016 study that we decided to examine a little deeper relates to safety critical designs and their silicon success. Intuitively, one might think that the rigid and structured process required to adhere to one of the safety critical development processes (such as, DO-254 for mil/aero, ISO 26262 for automotive, IEC 60601 for medical, etc.) would yield higher quality in terms of preventing bugs and achieving silicon success.
Figure 5 shows the percentage of ASIC/IC and FPGA projects that claimed to be working on a safety critical design.
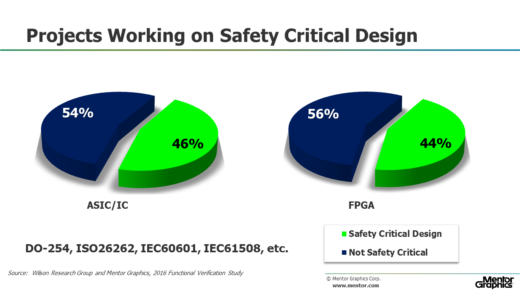
Figure 5. Percentage of projects working on safety critical designs
Keep in mind that the findings in Figure 5 do not represent volume in terms of silicon production—the data represents projects that claim to work under one of the safety critical development process standards. Using this partition between projects working on non-safety critical and safety critical designs we decided to see how these two classes of projects compared in terms of preventing bugs.
Figure 6 compares the number of required spins for both safety critical and non-safety critical ASIC/IC designs. While Figure 7 compares the FPGA designs with non-trivial bug escapes for both safety critical and non-safety critical designs.
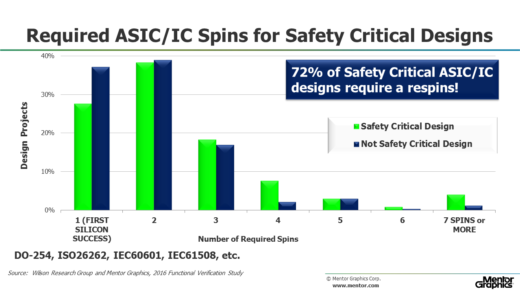
Figure 6. Requires ASIC/IC spins for safety critical vs. non-safety critical designs
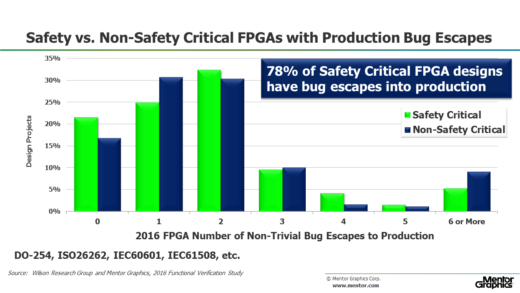
Figure 7. Non-trivial bug escapes for safety critical vs. non-safety critical FPGA designs
Clearly, the data suggest that a development process adopted to ensure safety does not necessarily ensure quality. Perhaps this is non-intuitive. However, to be fair, many of the safety critical features implemented in today’s designs are quite complex and increase the verification burden.
This concludes the findings from the 2016 Wilson Research Group Study.
Quick links to the 2016 Wilson Research Group Study results
- Prologue: The 2016 Wilson Research Group Functional Verification Study
- Understanding and Minimizing Study Bias (2016 Study)
- Part 1 – FPGA Design Trends
- Part 2 – FPGA Verification Effort Trends
- Part 3 – FPGA Verification Effort Trends (Continued)
- Part 4 – FPGA Verification Effectiveness Trends
- Part 5 – FPGA Verification Technology Adoption Trends
- Part 6 – FPGA Verification Language and Library Adoption Trends
- Part 7 – ASIC/IC Design Trends
- Part 8 – ASIC/IC Resource Trends
- Part 9 – ASIC/IC Verification Technology Adoption Trends
- Part 10 – ASIC/IC Language and Library Adoption Trends
- Part 11 – ASIC/IC Power Management Trends
- Part 12 – ASIC/IC Verification Results Trends
- Conclusion: The 2016 Wilson Research Group Functional Verification Study
Comments
Leave a Reply
You must be logged in to post a comment.

Very interesting study! However, this presentation seems to assume that all FPGAs and ASICs utilizes some verification methodology (“None” and “Other” are presented in the same category, which eliminates the possibility of determining what percentage of projects simply take their designs in the lab and cross their fingers). Sadly, this mentality still exists and is not statistically irrelevant I suspect. Two things I didn’t see addressed were 1) what percentage of designs are verified by the designer (as opposed to having a separate verification engineer) and 2) What percentage of designs utilize lab debug/prototyping AS OPPOSED TO chip level simulation for their verification. I realize not every question can be asked, but these seem to be a disturbing trend in my industry.
I suspect that the answer to question 1 is skewing the results of the Design-to-Verification Engineer ratio results.
Hi Tim,
Actually I do have data on (1) that I can share. I am currently in the middle of compiling the 2018 study, but will include this in the future. Also, what should be more interesting than the percentage of designs that are verified by the designer, but the trend wrt the percentage of designs that are verified by the designer.
-Harry