Simulation Performance Profiling Like a Pro

New product development is the fun part of working with Siemens. And over the past 9 months I’ve been lucky to work with the team building our next generation performance profiler. It’s been a good experience with a great team putting out a really compelling tool.
With the profiler being recently released with Questa and Visualizer, I saw it as a good time to share my thoughts and experience with the profiler to give you a feel for what it can do.
What is Performance Profiling?
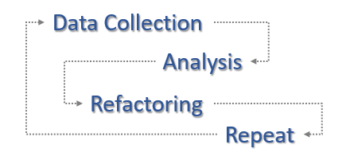
In a nutshell, performance profiling is the combination of simulation analysis and code optimization; the goal is squeezing everything you can out of each cycle.
Performance profiling starts in Questa with an instrumented simulation run. In that instrumented run, the profiler samples run-time activity within the simulator and dumps it to a database. Post-sim analysis is done in Visualizer where raw run-time samples are mapped back to user code and displayed in a series of tables and graphics.
The default performance dashboard view is where you start your analysis. Summaries for language, file and design unit activity are focus points for me. Also useful are the more targeted line and call-stack summaries. Keying off red highlighted areas of interest, you continue into the detailed analysis views.
The detailed views add code snippets, time consumed (absolute and relative) and links back to the source code for performance hotspots (hotspots are chunks of sub-optimal code that unnecessarily blow up simulation run-times). From there, you take action with code optimizations.
A key feature of the profiler is the global filtering. Drag-n-drop items from the dashboard or detailed views to focus analysis on very specific areas of your testcase, for example, design hierarchies or testbench packages. Filtered views are particularly useful in analysis of large SoC’s where teams of people are contributing to the analysis and optimization.
As an example, the snapshot above shows the global filter being used to focus on a user defined env_pkg. If this is code you wrote, this gives you the opportunity to focus on it and ignore everything else.
What to Expect
In my experience with customer testcases, I typically see one of three outcomes:
- Big gains achieved by re-coding an obvious performance hotspot;
- Small to moderate gains achieved by re-coding a set of performance hotspots; or
- Nothing much.
The large gains are the high value targets you’re after. A couple lines of code can choke an entire testcase; refactoring those lines delivers dramatic improvement. Best I’ve seen is a couple hours of analysis leading to 4 lines changed for 8x improvement. True story. We cut an 8 hour sim down to 1. They’re not common, but these types of egregious coding mishaps do happen. You have a seemingly benign bit of code that gets the job done functionally but performs horribly. And you don’t realize how horrible it is until you profile the testcase. The value in profiling these cases is obvious; the corresponding gains immediate.
The small to moderate opportunities are more likely, typically falling in the 5-20% category. Expect these to take more effort to analyze and characterize. Refactoring may involve a series of isolated code tweaks – maybe one construct being updated in several places – each with the intention of incremental run-time improvements of 1-5% that accumulate into something meaningful. Because these smaller optimizations require more effort, you’ll want to balance that effort with the expected outcome. In my experience, you’ll see hours of effort for 2% improvement as worth it; days for 2% probably not.
Finally, you will see cases with no obvious opportunities for code optimization. If you’re in this situation, consider yourself lucky. It means your sims are already running as fast as possible. No further action required!
When to Profile
I recommend integrating performance profiling as a normal development activity. Start dumping and analyzing profiles on a periodic basis as soon as you have passing tests. Take a small set of those tests that represent your overall testsuite, dump profiles for those tests and do the analysis to identify sub-optimal coding habits. To start, be on the lookout for the ‘big gain’ scenario. Those are easy to spot and tend to be easier to optimize. As you run more endurance tests, shift toward optimizing ‘small to moderate’ hot-spots to ensure you’re squeezing out every possible cycle. Use the analysis/optimization feedback as learning opportunities to shape future coding habits and style guides.
An alternative approach is to wait until you’re well into running regressions and you start hitting hardware limits. Performance profiling enables a path to maintaining or increasing throughput without adding compute infrastructure. Of course the downside of this reactive approach is that you’ve already wasted simulation cycles. But later is better than never assuming you still have regressions to run before tape-out.
Honourable mention is profiling your long pole simulations. This is probably the most obvious entry point to performance profiling because long pole sims are also your regression bottlenecks. Optimizing a long pole sim doesn’t just reduce time for the sim proper, it’s a reduction for an entire regression. Profiling is worth it here.
Who Does The Profiling?
I see the primary audience for performance profiling being verification engineers. Not that I want to discourage design engineers from getting involved. But typically the actionable hot spots are in the testbench code because behavioural testbench constructs give more coding flexibility. That flexibility enables a much wider performance spectrum for possible testbench code that runs anywhere from very slow to lightning fast. Profiling helps ensure you’re running on the fast end of the spectrum.
Your Turn
Performance tuning of customer designs is a really enjoyable part of my job with the product engineering team at Siemens. At the risk of sounding like a total performance nerd, a good day is just me, the profiler, a customer design and a goal.
If you’re working with Questa 2021.2 or newer, I’d recommend a profiler testrun. If you’re running an older version, work with your AE and/or IT to get a new version installed. The profiler is relatively intuitive for new users so take some time to kick the tires.
And there’s more to come on this topic. Check back in a few weeks for more information on driving the tool and analyzing your code. Or if you can’t wait that long, go ahead and reach out to me at neil_johnson@mentor.com and I’ll give you a hand.
-neil


